Improvements in Affordability
This Graph & Article compares affordability levels over time and helps us understand the first time buyer market
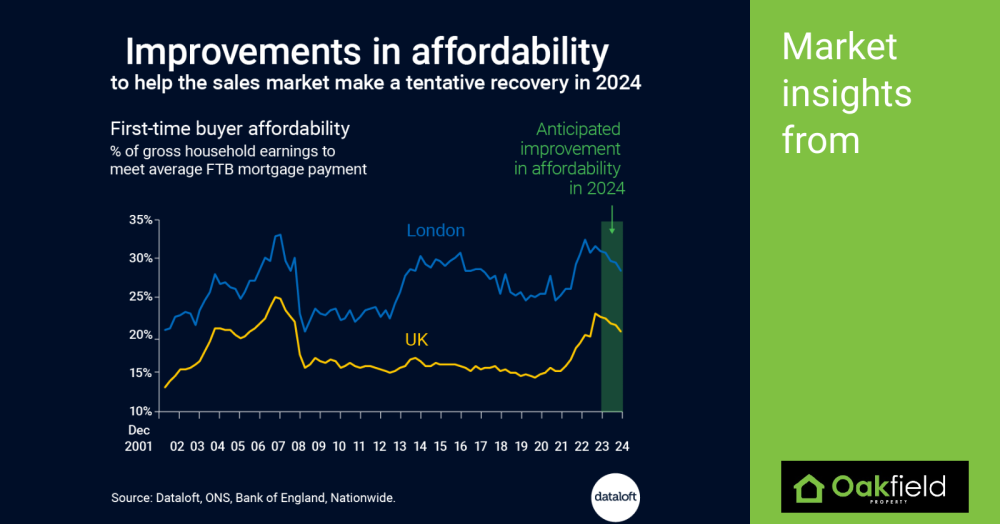
Comparing affordability levels through time helps us understand when a market needs to slow down (affordability is overstretched) or when a recovery can take hold (improved affordability).
A combination of factors (chiefly the expectation of better mortgage rates) will see affordability improve in 2024 and help drive a tentative recovery in buyer confidence.
Lower recent 5-year swap rates (4.4% at the end of November) point to further improvement in mortgage rates.
Affordability, as measured here, represents the proportion of household earnings it takes to meet mortgage payments. Source: #Dataloft, ONS, Bank of England, Nationwide. Affordability is based on FTB prices, assuming 1.5 full time incomes per household; 80% loan to value and average new lending mortgage rate; forecast earnings growth of 3.4% for 2024; average new lending rate to improve to 4.5% by end 2024; FTB price fall of -1% for remaining quarter of 2023 and then stabilised.
If you require any help as a first time buyer then please call us and we will be able to send you a free guide on buying your first home.